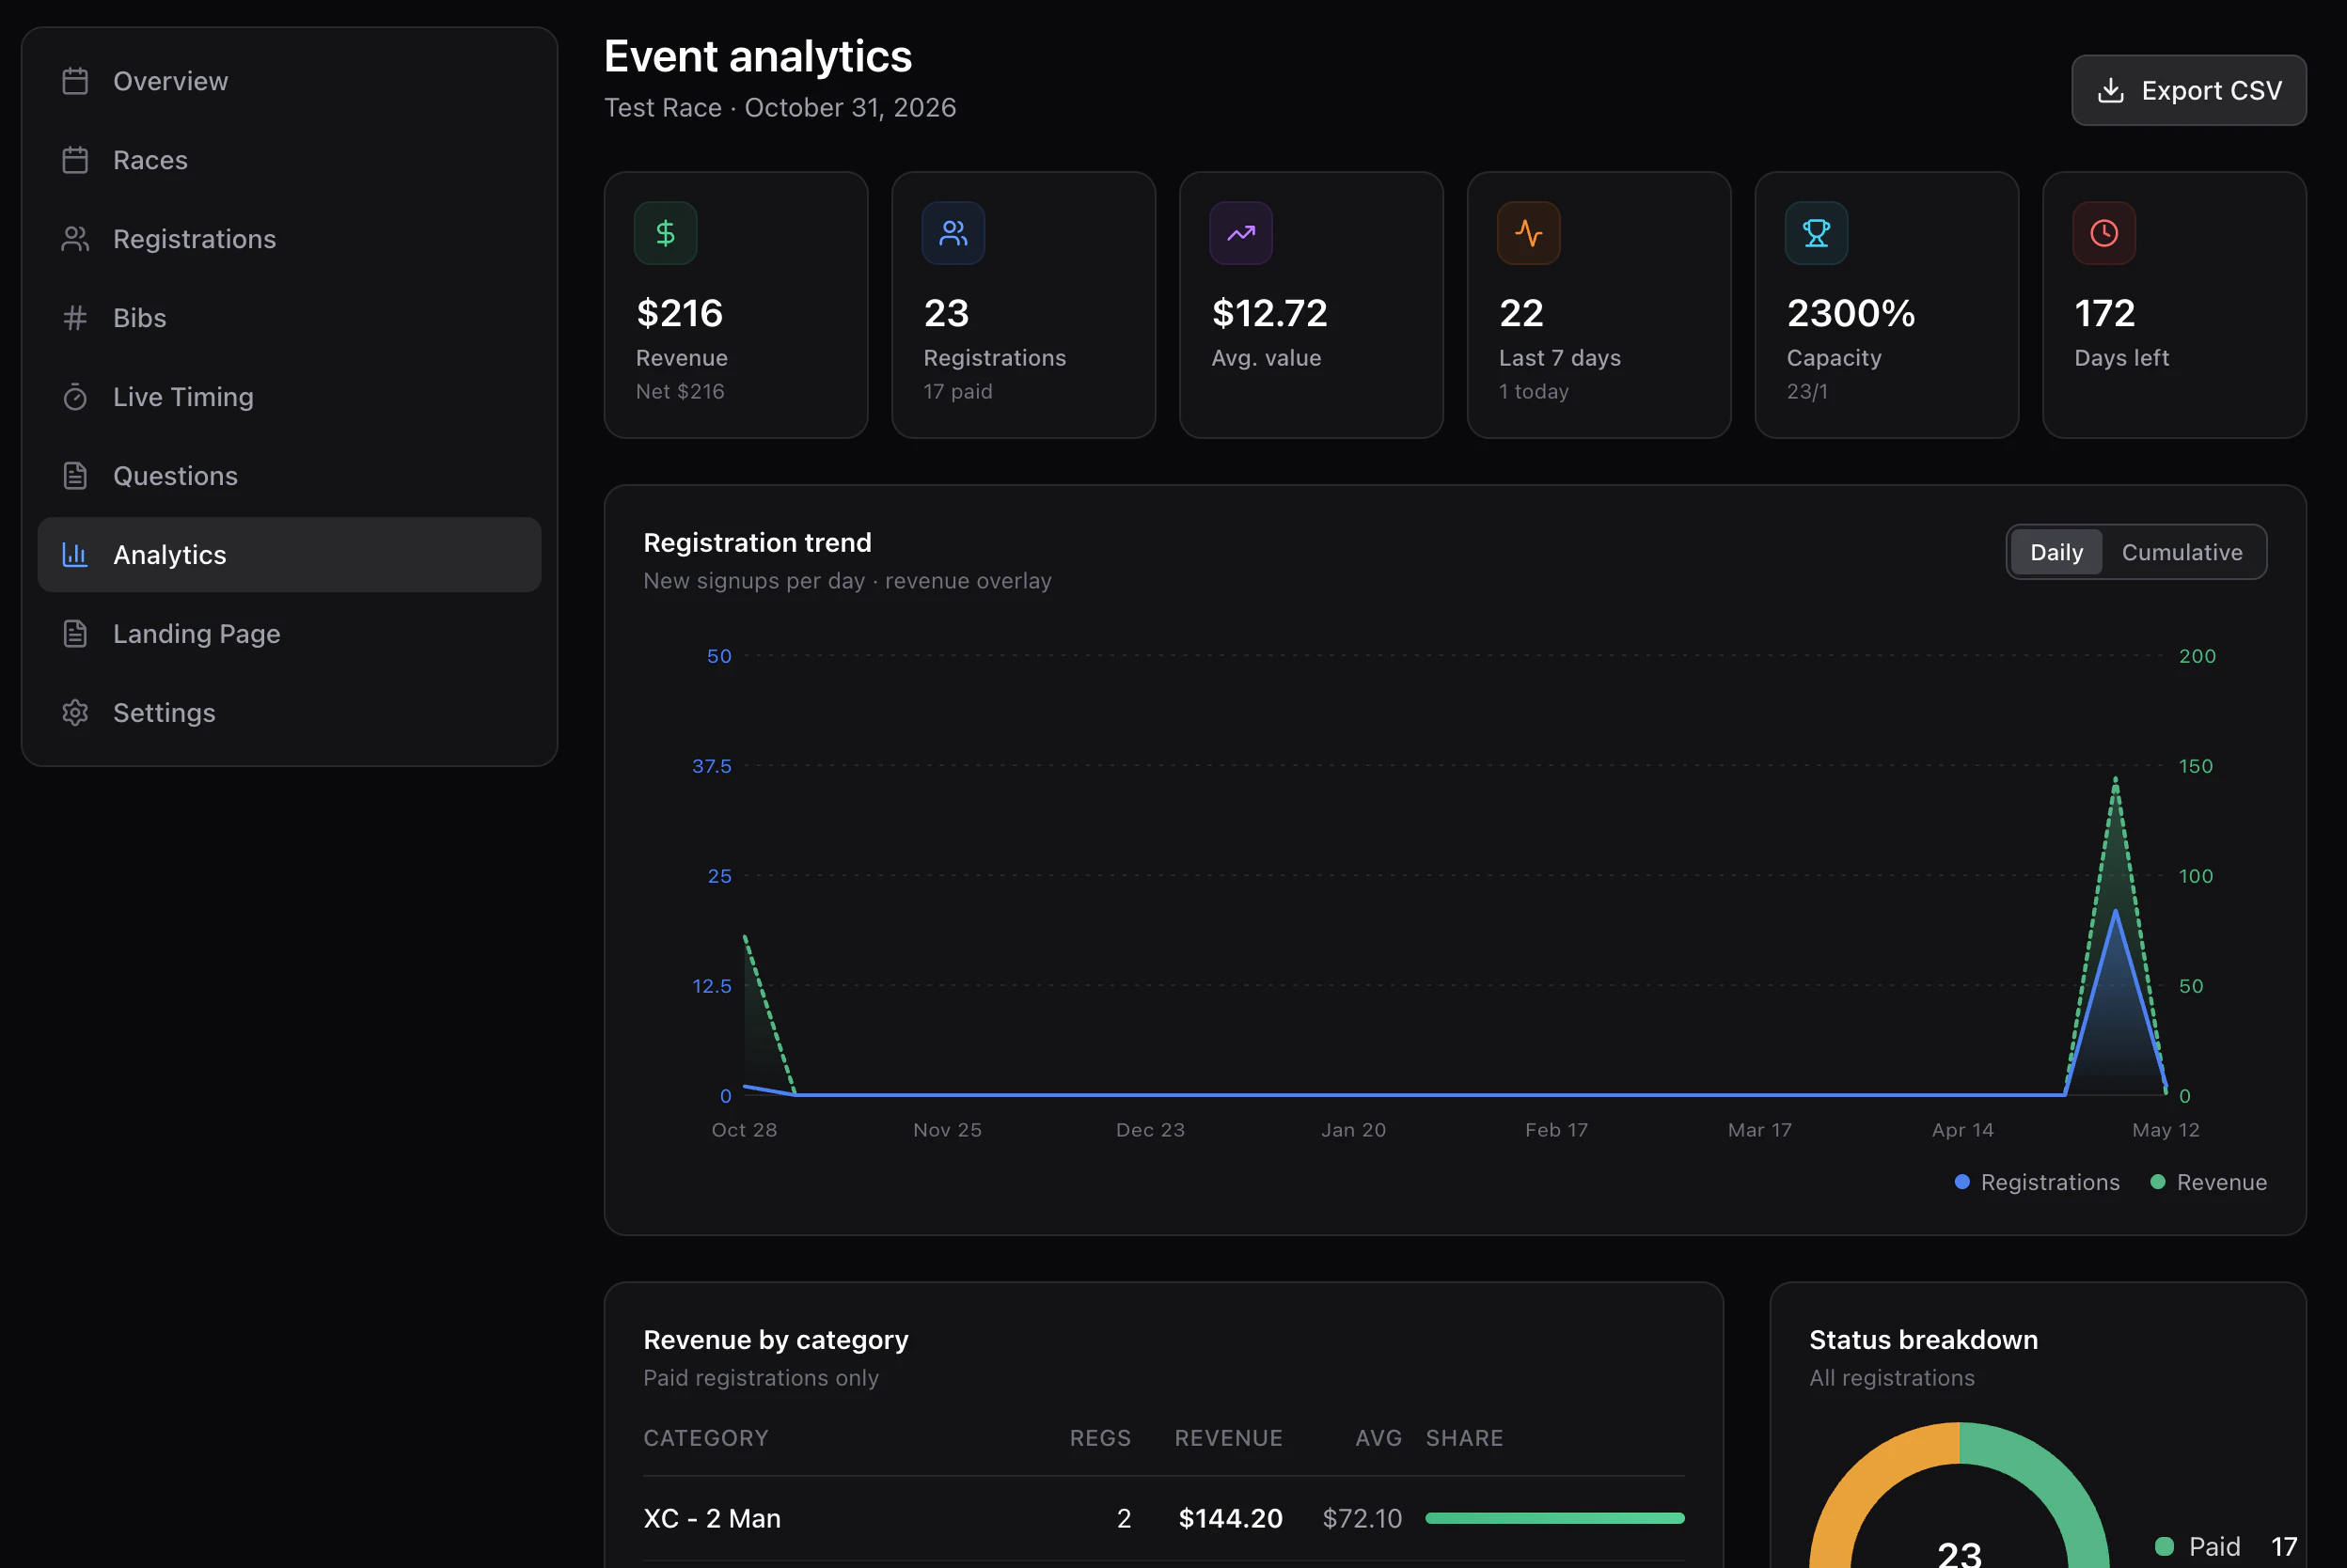
Headline KPIs
- Total revenue (gross), net revenue, refunded.
- Total / paid / cancelled registrations and average value.
- Days until event and registrations today / last 7 days.
- Total capacity and % filled.
- Unique racers (deduped by email + name).
Charts
- Cumulative registrations + daily revenue dual area.
- Activity heatmap — weekday × hour of when riders register.
Breakdowns
- Category and race — registrations, revenue, capacity fill, average price.
- Status — paid / pending / cancelled / refunded donut.
- Source —
web,manual,api. - Attribution — channel, campaign, referrer, top landing pages, attributed registrations.
- Demographics — age, gender, state, country.
- Top discounts — codes with redemption counts and dollars off.