/organizations/[id]/analytics rolls every event into a single dashboard. Use it to compare seasons, understand demographics, and see which marketing channels are working.
Window selector
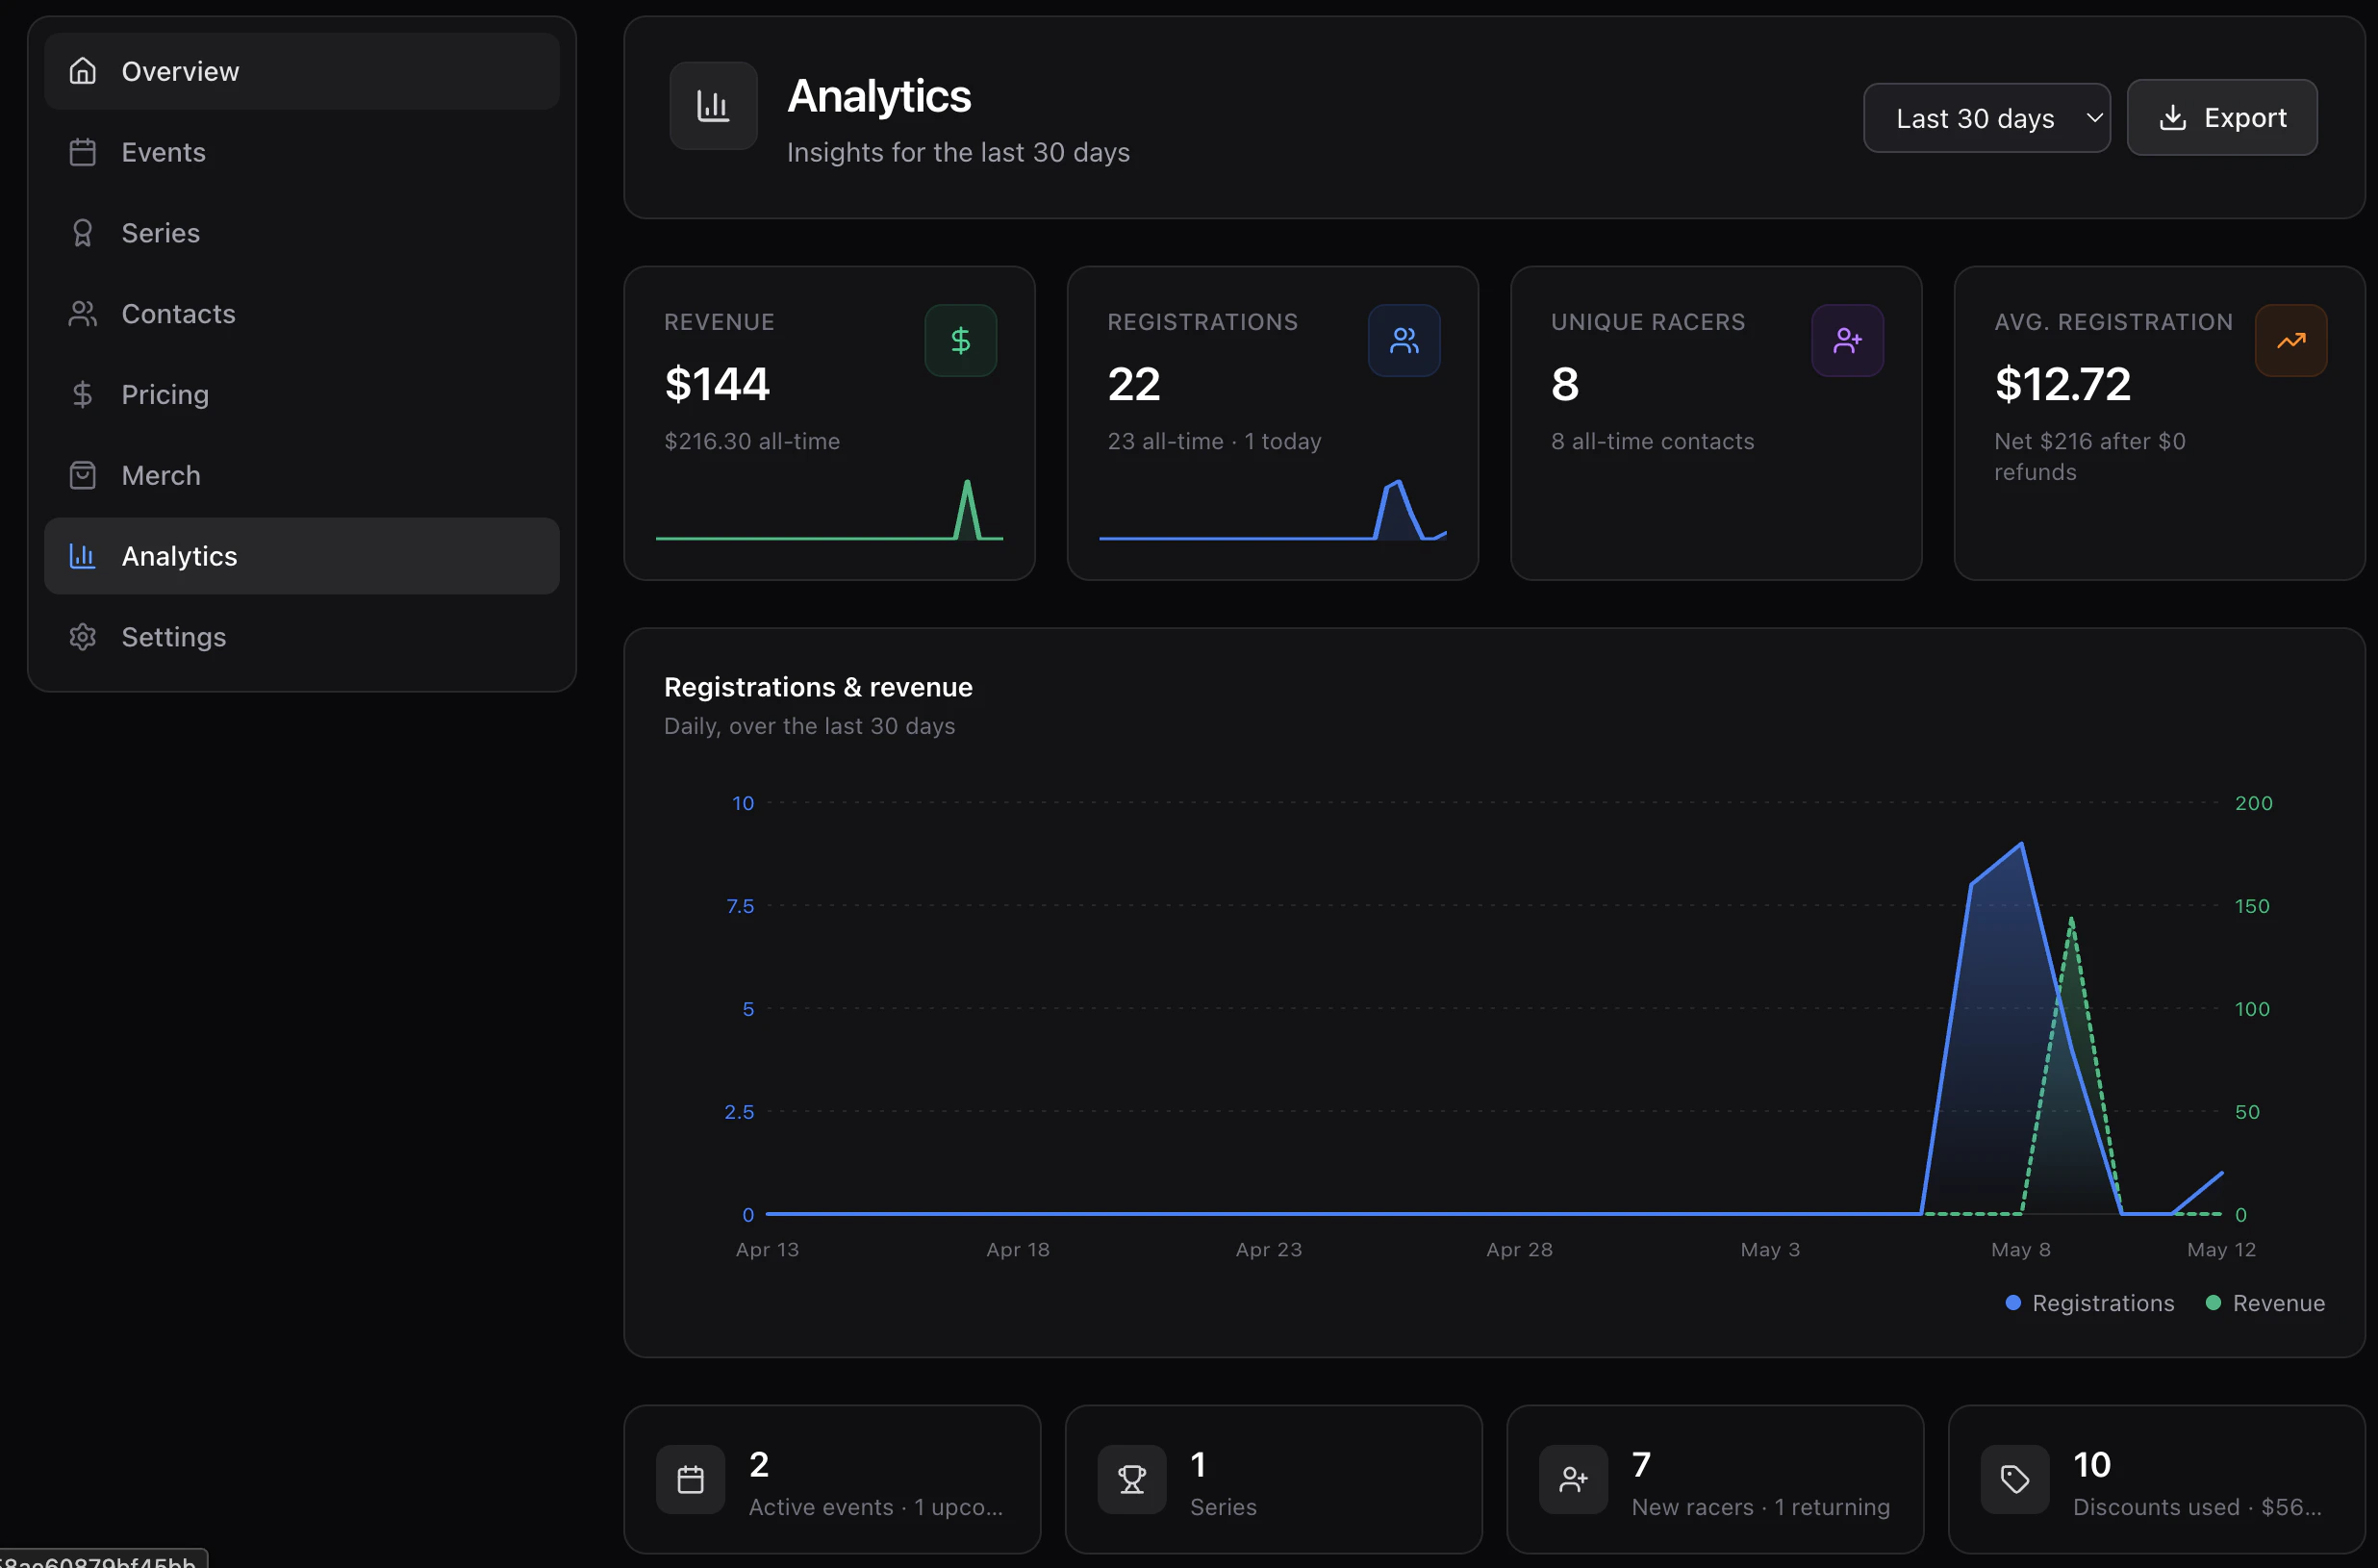
Pick 7d, 30d, 90d, YTD, or All time from the header. Every number below the picker updates.Headline stats
- Total revenue (gross), net revenue (after refunds), refunded amount.
- Total / paid / cancelled registrations.
- New vs returning registrants.
- Average registration value.
- Today and last-7-days registration counts.
- Discount usage — codes created, redemptions, total discounted.
Time series
A dual area chart of registrations and revenue by day across the window, plus an activity heatmap of weekday × hour.Breakdowns
- By event — registrations, revenue, and capacity fill per event in the window.
- By discipline, gender, age bucket, state.
- By status and by source (web, manual, API).
- Attribution — channel, campaign, referrer, top landing pages (see SEO & sitemaps).
- Top discounts — most-redeemed codes and total dollars discounted.